DashForge
← All work

Small-batch bakery

Proof

You already have the data. This is the part that reads it.

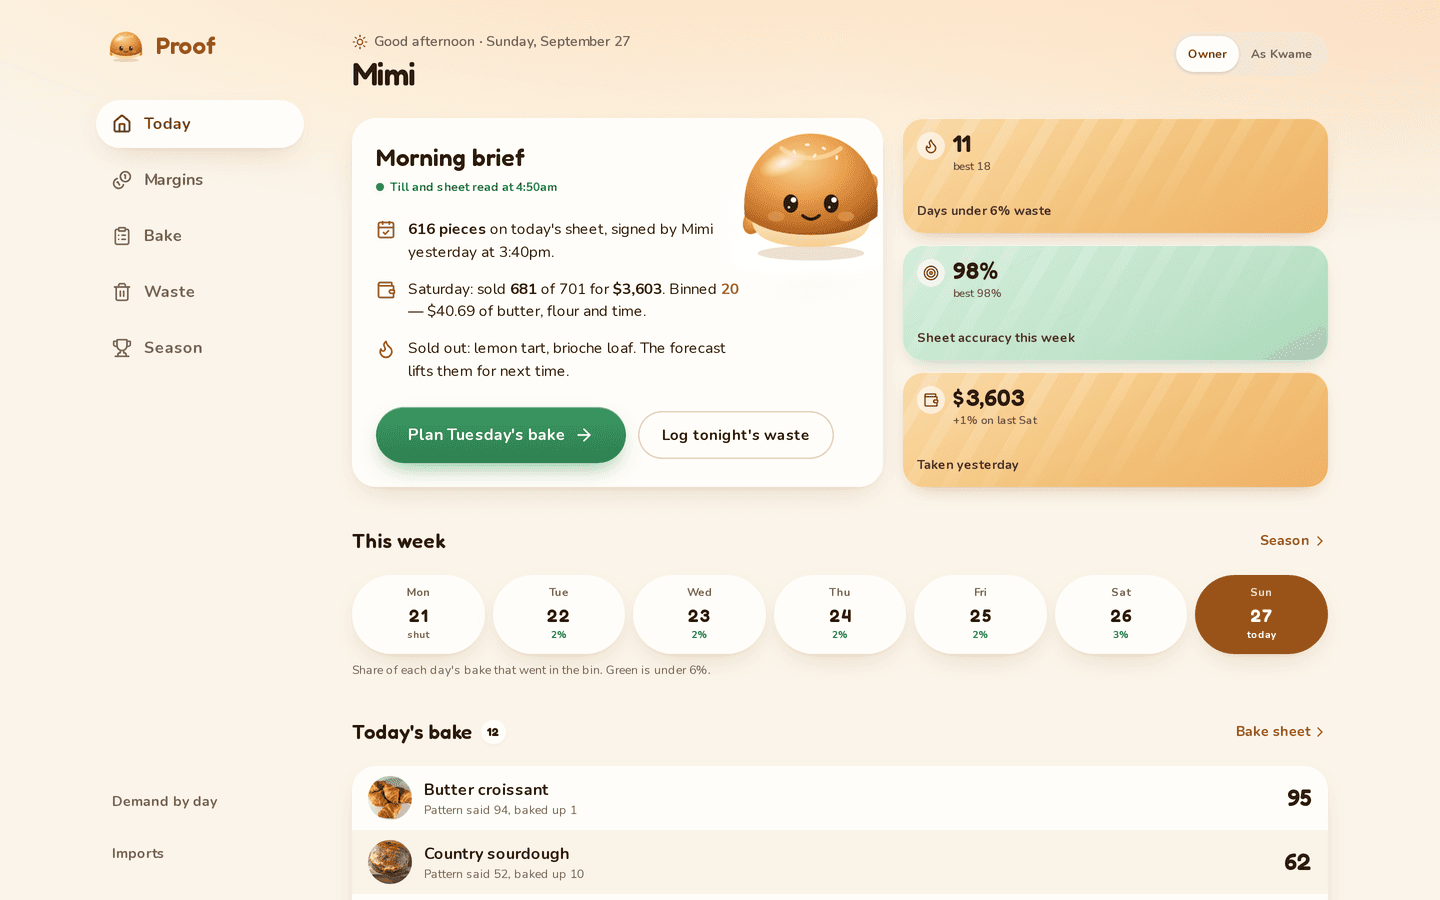
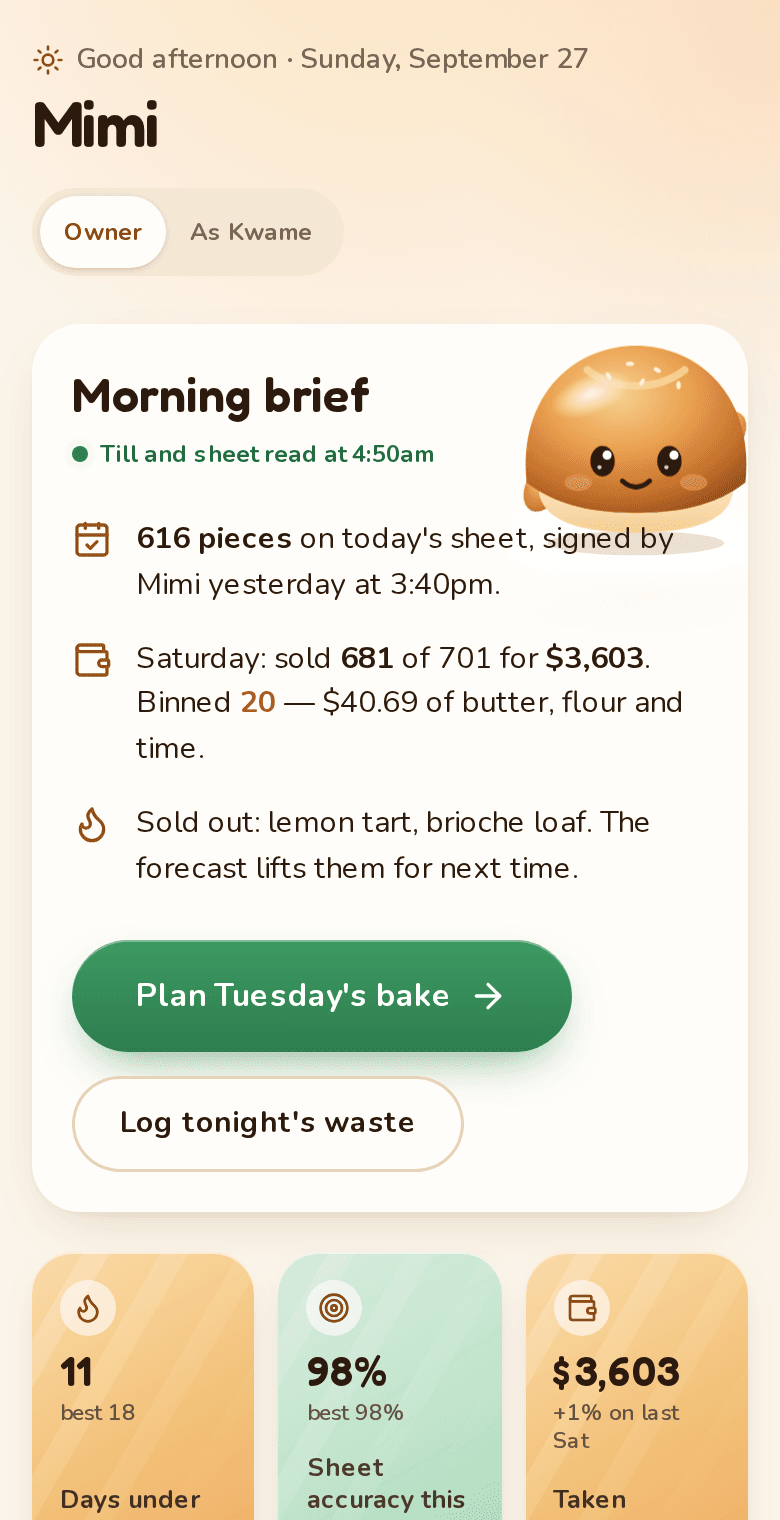
A reporting dashboard that adds no work to anyone's day. It pulls what the point-of-sale and the production spreadsheet already record, and answers the questions the owner was guessing at: what actually makes money, what gets thrown out, and what next Tuesday looks like.

CloudPremade
New data entry
None

reads existing exports

Margin visibility
Per item

ingredients and labour counted

Refresh
Nightly

ready before opening

What was going wrong

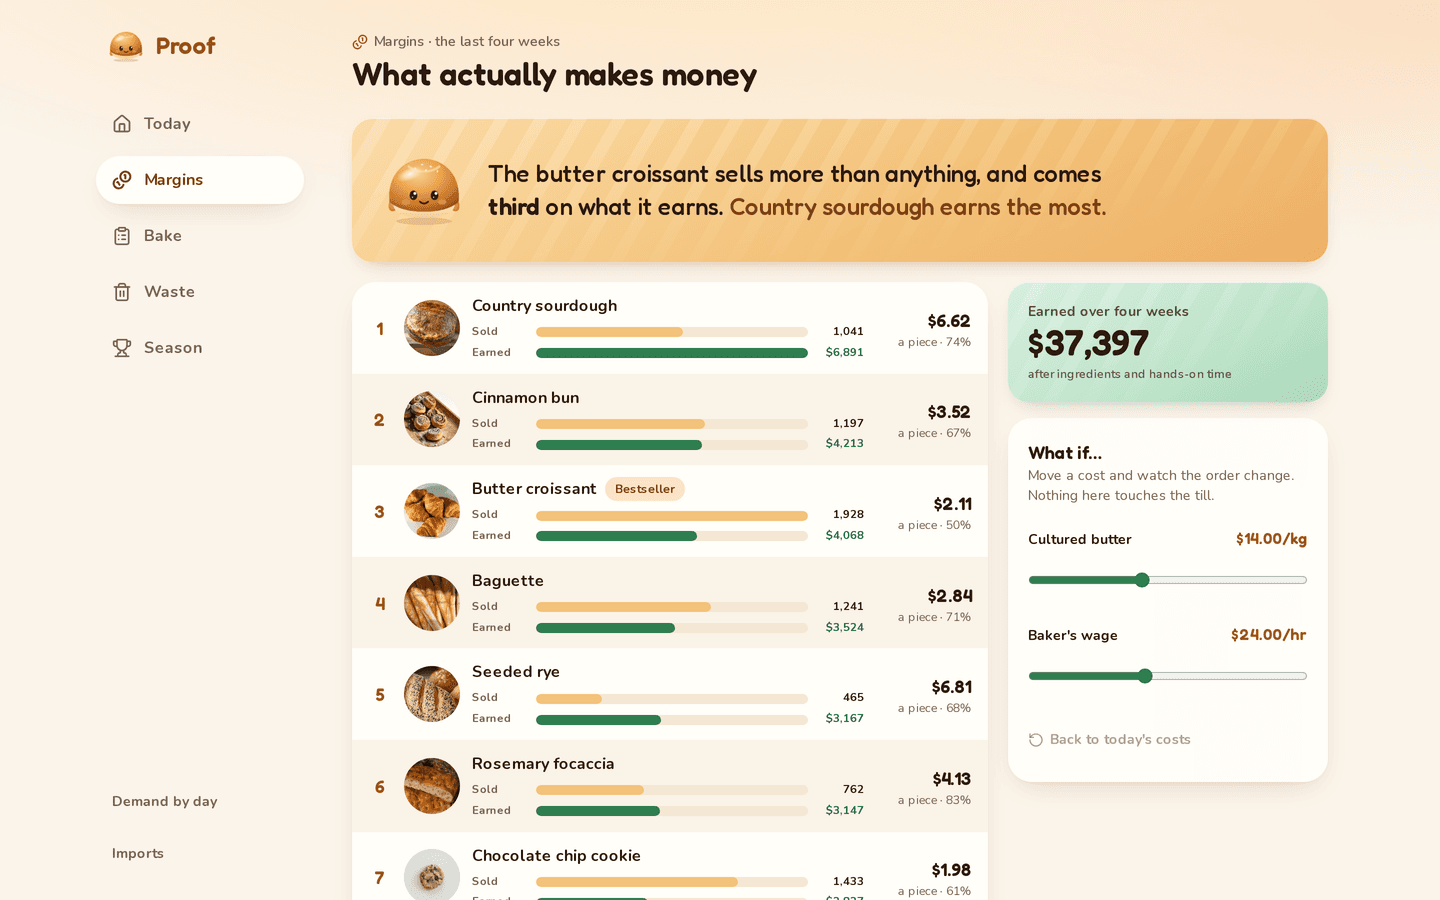
The bakery's numbers existed — in the point-of-sale, in a production spreadsheet, and in a notebook by the ovens — but never in the same place. The owner knew the croissants sold out and assumed they were the moneymaker. Nobody had put the butter against the price.

What we built

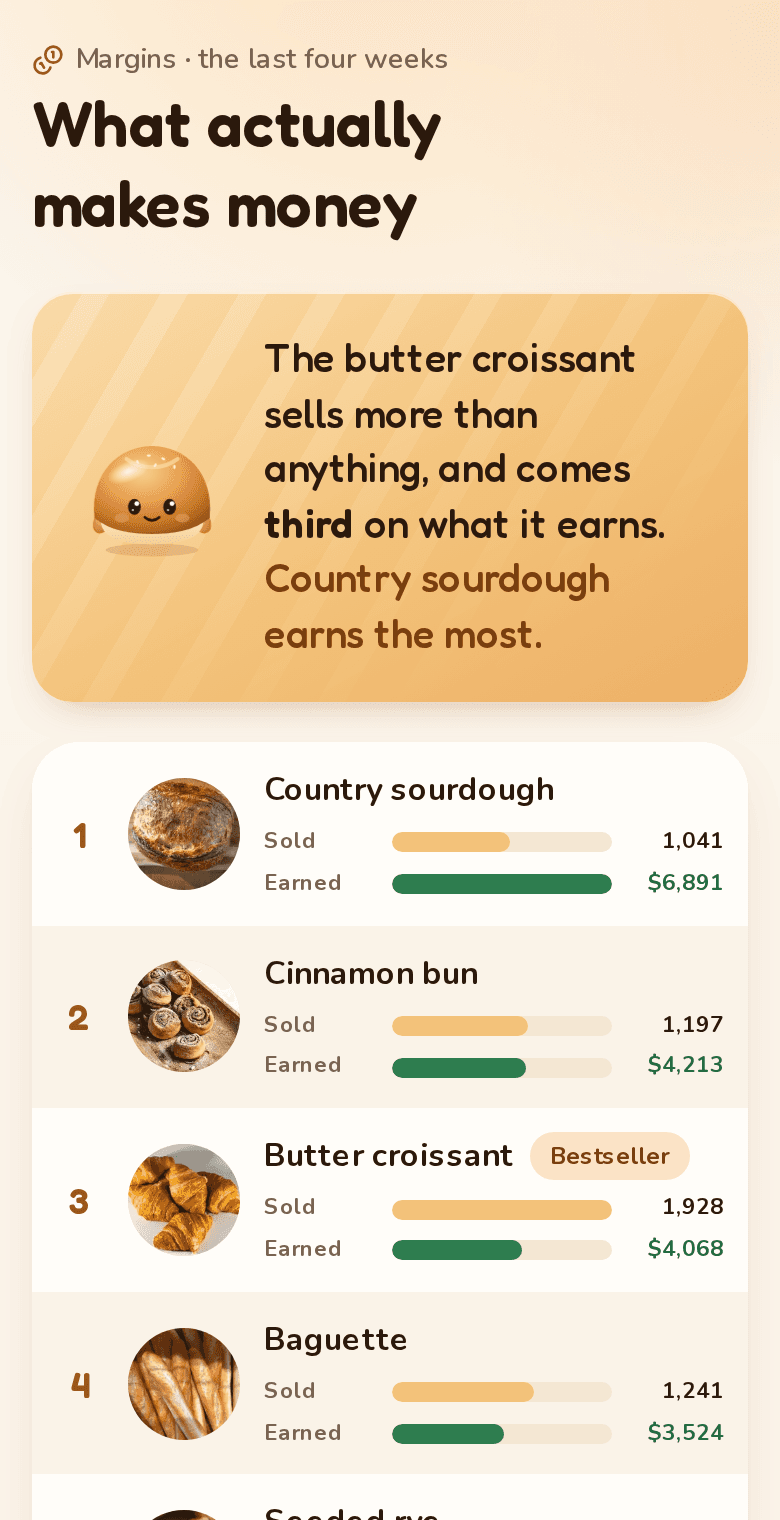
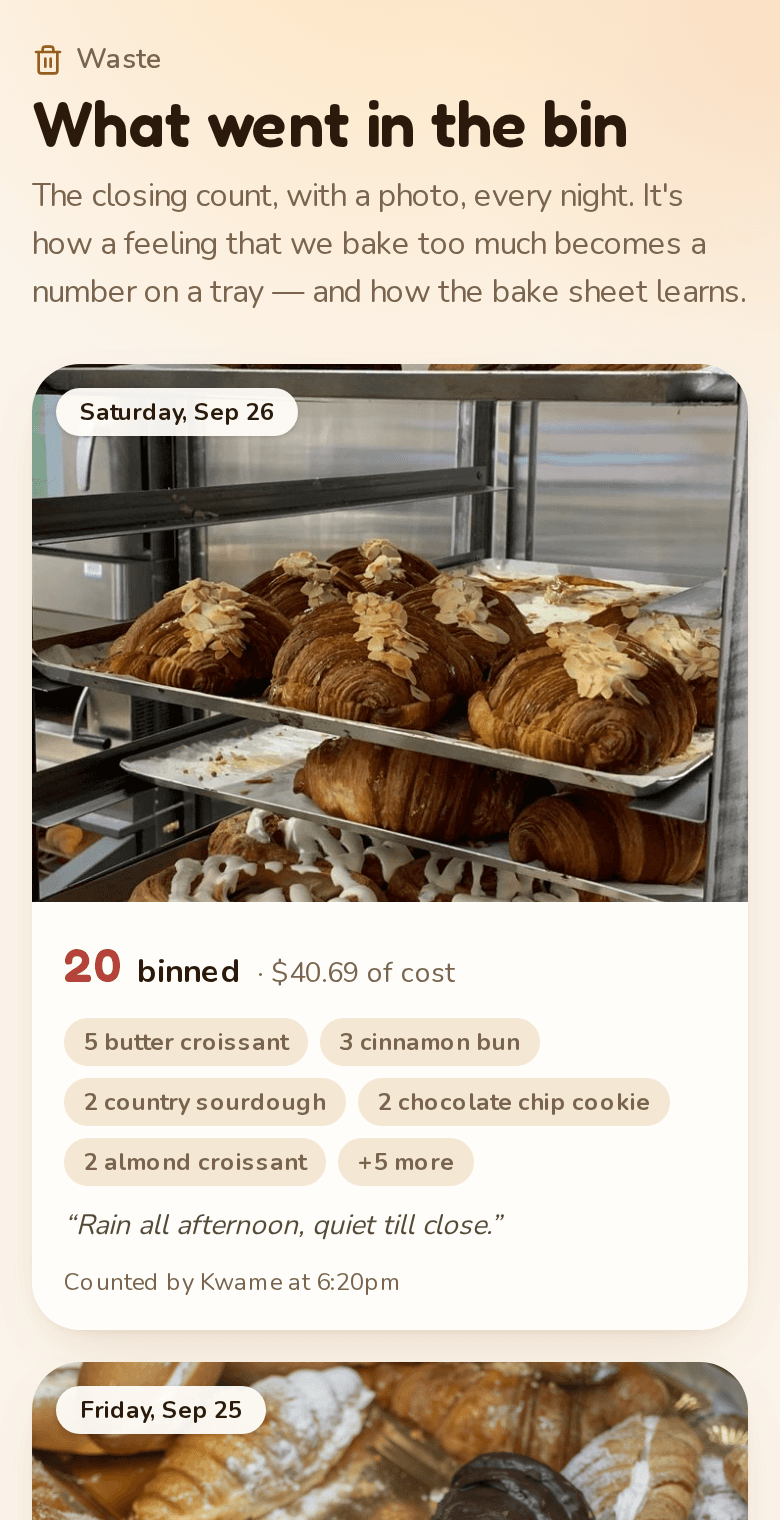
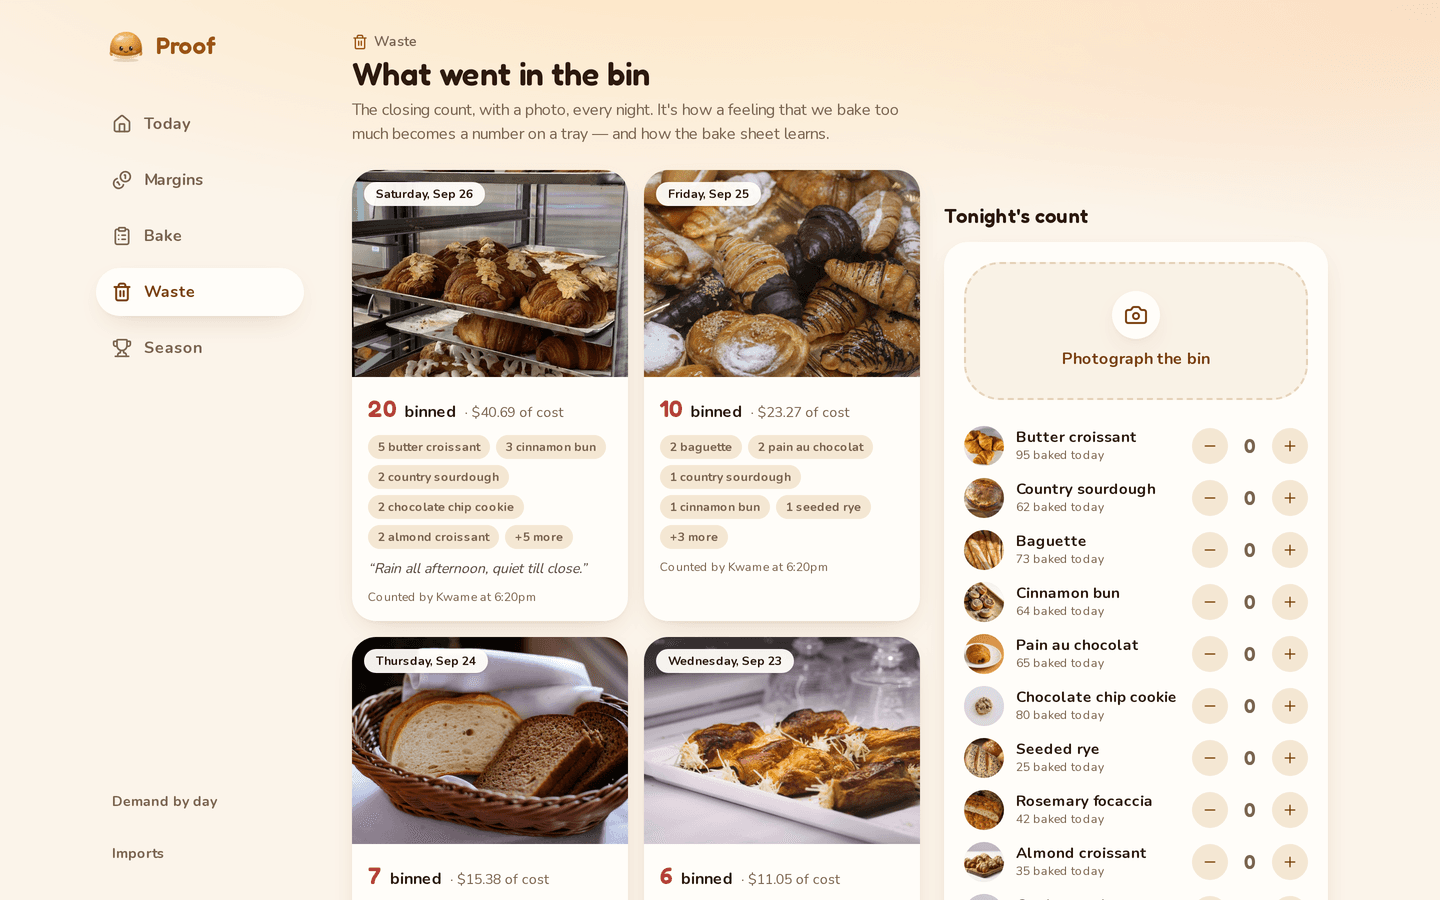
Change nothing about how they work. A scheduled import pulls the POS export and the production sheet each night into a small database, joins them, and puts real margin next to volume. The bestseller turned out to be third on margin. Waste, which had been a feeling, became a number attached to a specific day and a specific tray.

What it looks like

The screens this build was designed around.

Margin against volume

What sells most next to what earns most. The gap between those two bars is the whole reason this dashboard exists.

proof.dashforge.ca/margins

Items tracked

34

Gross margin

58%

up 3 pts

Data entry added

None

reads POS export

Share of units sold vs share of profit

last 12 weeks
  • Share of units
  • Share of profit
Croissant
28%
11%
Sourdough
19%
24%
Cinnamon bun
14%
9%
Focaccia
8%
17%
Baguette
12%
6%

Both measures are shares of the same total, so they sit on one axis. The croissant is the bestseller and the third-best earner — that gap is the reason this dashboard exists.

Demand by day

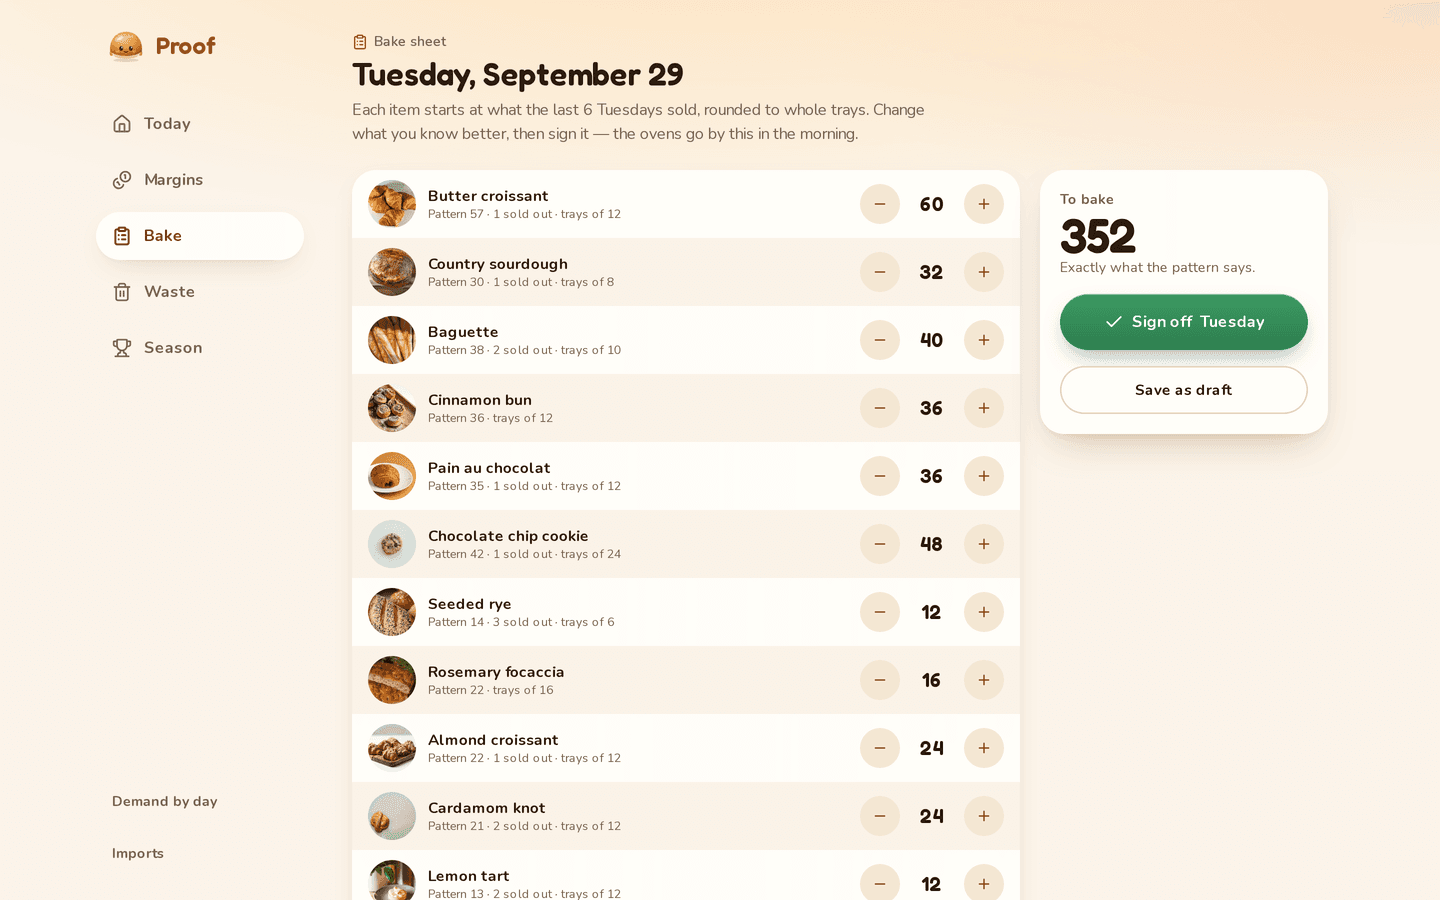
Twelve weeks of sales collapsed into a weekly shape, so production is planned on the pattern instead of on last Saturday.

proof.dashforge.ca/demand

Loaves sold by day

12-week average
MonTueWedThuFriSatSun

Saturday peaks at 187 — production is planned on the pattern, not on last weekend.

Waste, by day

trays discarded
DayTraysCost
Monday6$74
Tuesday3$38
Wednesday2$21
Sunday9$118

Sunday over-bakes on Saturday's shape. Now it is a number attached to a tray, not a feeling.

What it does

Who reaches for it, and when

The owner on a Sunday

Sets next week's production off a pattern instead of off last Saturday.

Pricing a new item

Puts the butter against the price before the item goes on the board.

The end of a bad month

Waste stops being a feeling and becomes a number attached to a specific tray.

What makes this one different

  1. It changes nothing about how they work

    The hardest part of a reporting product is the data entry it demands. This one demands none, which is why it was still running six months later.

  2. The bestseller was third on margin

    Volume and margin on the same chart is the whole reason the dashboard exists. The gap between the two bars was the finding.

  3. Nightly, before opening

    The refresh runs overnight so the numbers are already there when the ovens go on, rather than being something to go and fetch.

Built with

What each piece is doing here — the people who read this section are usually the ones who would have to maintain it after us.

Want something like Proof?

It does not have to be your industry — the underlying problem is nearly always the same. Tell us how the work moves through your business and we will tell you what it would take.

Every project is quoted on its own. Turnaround starts at two weeks.